Connections globe – An overview
What is it for?
This template comes into its own when visualizing connections between different cities, regions or countries, spanning the globe. Featuring customizable globe skins, different zoom levels using the story player and many other features, you are able to upload your data and start telling your story.
How to get started
1
The template comes with its own globe, however you can choose between different globe skins or even upload your own. To achieve this, head to preview mode, click on Design, then Globe Surface. You are able to pick between different globe colours and even a satellite view.

2
But how to create these connections? First step would be to set the locations you wish to create a relationship between them. Head over to the data sheets and then to Locations.
3
There you can insert, in different columns, the location names, their coordinates and importantly, codes for each location. These codes will be used to connect the locations to the values of the Values sheet and plot the arcs.


4
The Values data sheet should contain first and foremost a column designating the source locations and one of the source destinations of the different value transfers. In them, you should specify the locations not by their name, but by their code, in order for values, locations and coordinated to get connected with each other.
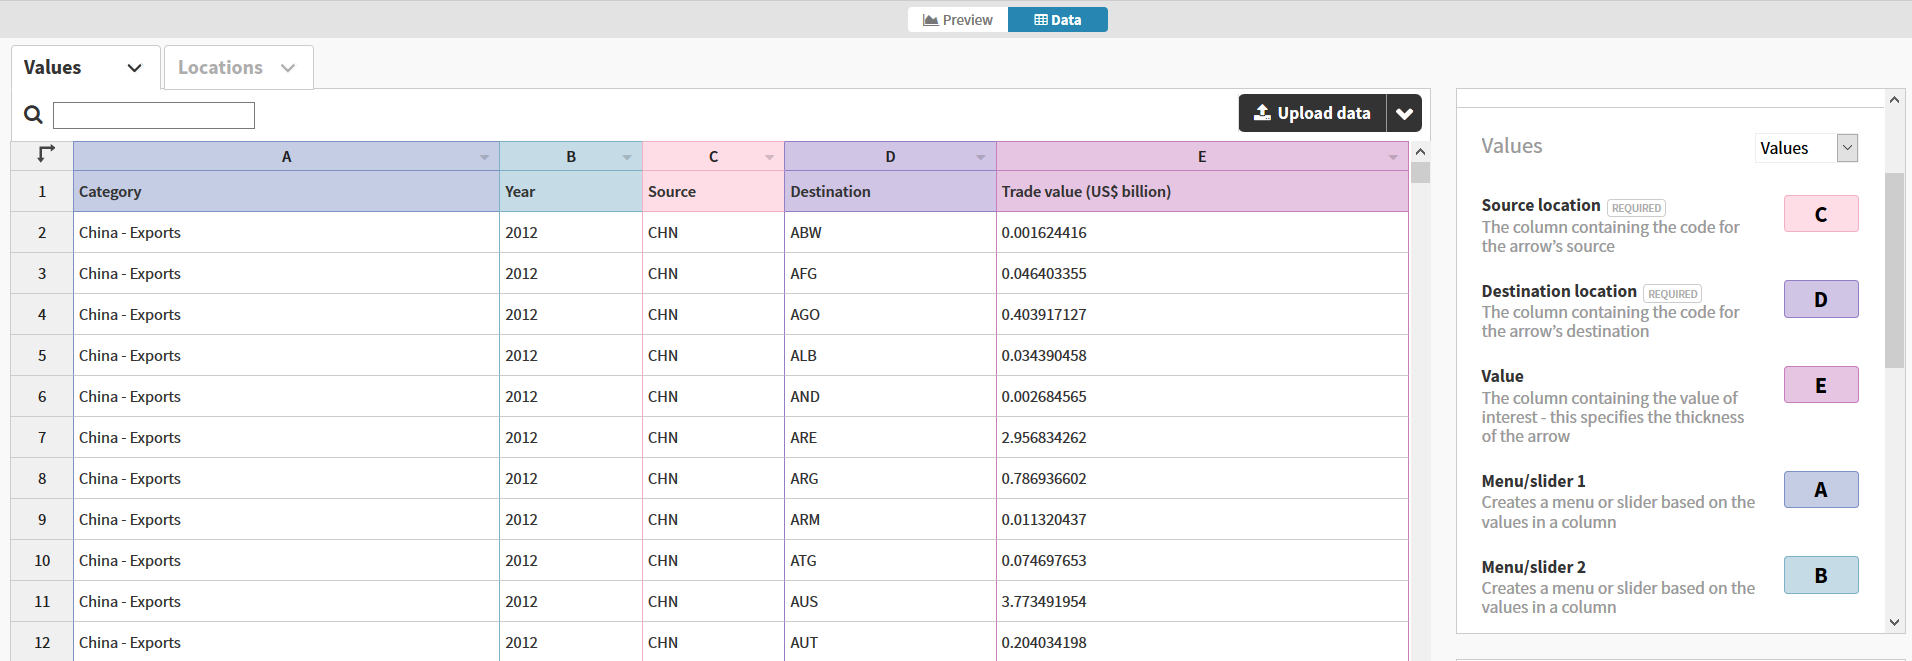
5
It is also possible to add value amounts in order to visualize the dimensions of the connections and categories if you wish to filter them.


