Hierarchy – an overview
What is it for?
This template is great for summarizing your data across different categories. You can think of it as kind of a visual pivot table. It includes four visualization types that you can quickly switch between: a treemap (subdivided rectangles), packed circles, a radial partition chart (like a multi-ring pie chart) or a stacked bar chart.
How to get started
- 1
-
Your data should be in a long format, i.e. each row represents a single data point and each column represents a variable. For example:
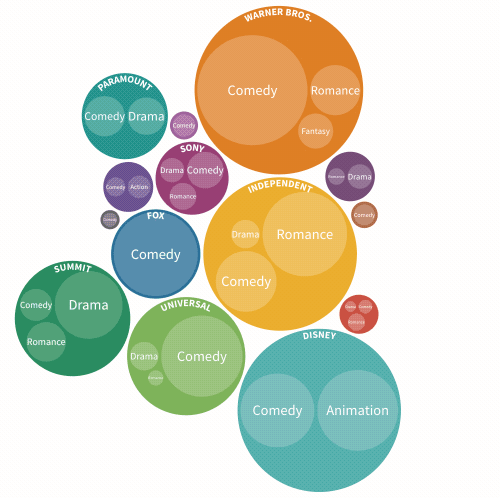
Film Genre Lead Studio Audience score % Profitability Rotten Tomatoes % Worldwide Gross Year 27 Dresses Comedy Fox 71 5.3436218 40 160.308654 2008 (500) Days of Summer Comedy Fox 81 8.096 87 60.72 2009 A Dangerous Method Drama Independent 89 0.44864475 79 8.972895 2011 A Serious Man Drama Universal 64 4.382857143 89 30.68 2009 Across the Universe Romance Independent 84 0.652603178 54 29.367143 2007 - 2
- If your data isn't already in a long format, you can transform it using the Flourish data table's unpivoting function

- 3
-
Columns can be seen as either categorical (e.g.
GenreandStudio) or numeric (e.g.Worldwide Gross)Choose:
- Categorical columns to nest your data by
- Numeric columns to size the rectangles or circles by
For example, if we wanted to know which studio took the most revenue we could nest by
Studioand size byWorldwide Gross.If we wanted to further break down each studio into genres, we could nest by
StudioandGenre.
- 4
- If you're nesting by two or more columns, you'll be able to zoom into a category by clicking. Zoom out by clicking the arrow that appears in the top right of the chart.

- 5
- You can specify the amount of visible levels in the Hierarchy settings. This is also where you can choose between the four different types of hierarchy.
-

- 6
-
Try varying the amount of visible levels within a Flourish story to gradually break down categories into sub-categories


Hierarchy Popups
On the Hierarchy template you have various options of when to show popups
 All levels shows popups on every different Hierarchy. The rest of the options are:
- Top Level only - This will only show popups when you hover over the hierarchy's top level
- Below top level - This shows popups on every level except the top level
- Above bottom level - This shows popups on every level except the bottom level
- Bottom Level only - This shows popups only on the bottom level
