Creating a visualization
Creating a visualization in Flourish is the first step toward making a stunning data-driven project, and you can do this in a matter of seconds!
 .
.
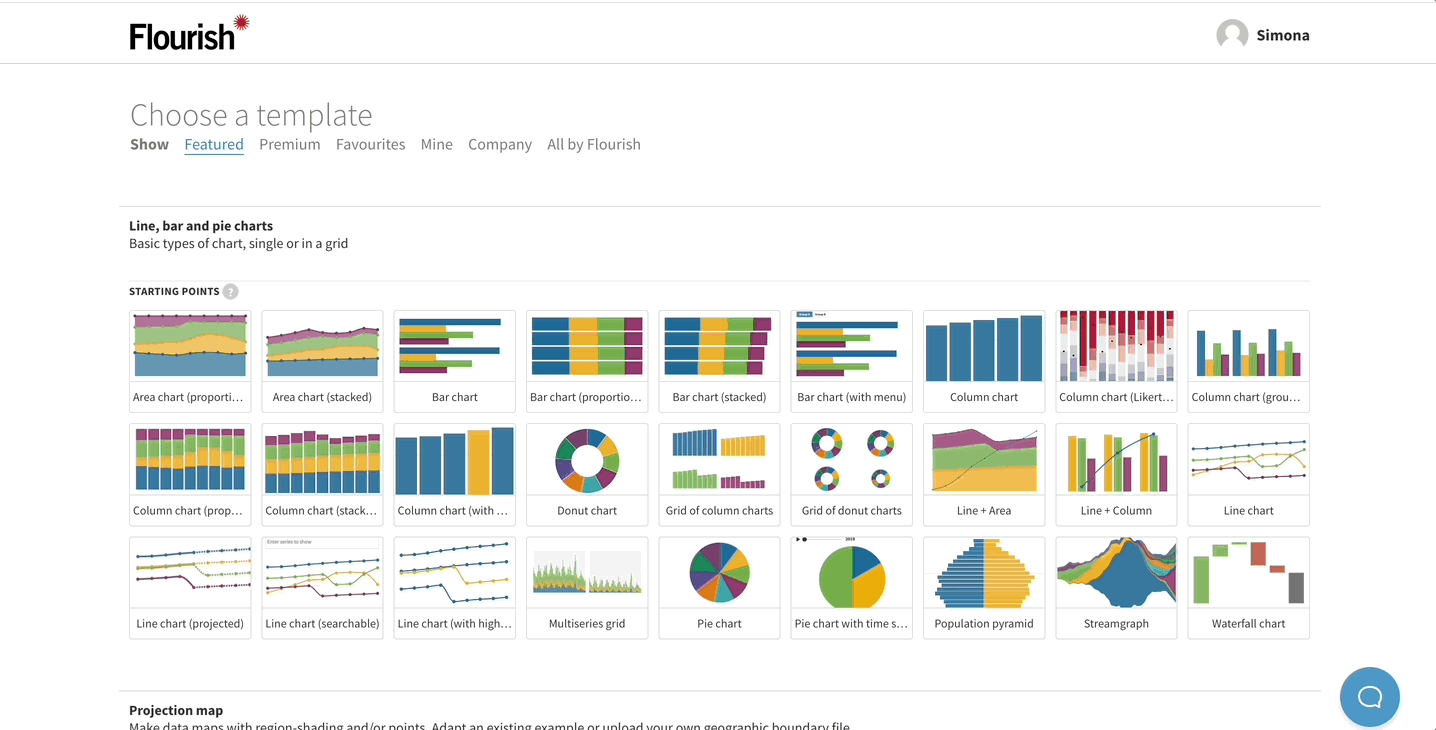

TIP: Starting points are just examples made with a template. Once you open a starting point, you can adjust the template-specific settings, so your project resembles a different starting point.
TIP: Not sure which template is the right choice for your data? Check out our help guide for more information.

- Preview tab – this is where you can see what your project will look like when it's published.
-
 Data tab – this is where you should upload your own data. If you edit or replace any information within these cells, your visualization will instantly reflect these changes.
-
 Some Data tabs have more than one data sheet. If you are not sure how your data should be structured, or what each sheet affects in the visualization, we recommend reading the template-specific help docs. You can also access them through the chat symbol in the bottom right-hand corner of every page!
-
- Column bindings – which let you control which columns of data are used in the visualization, and in what way.

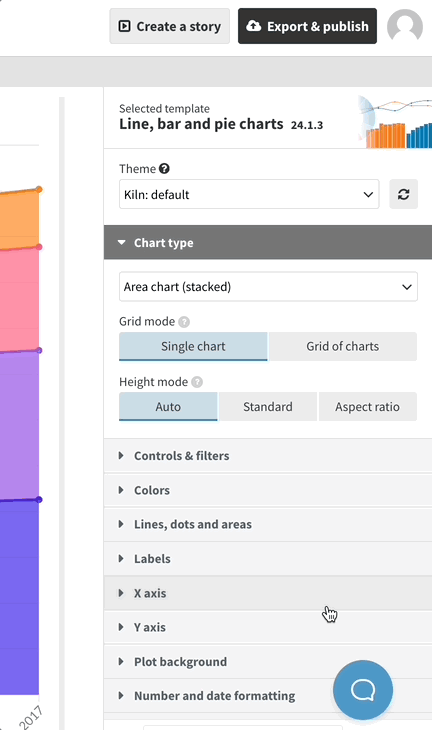
- Preview settings panel – which lets you change the look and feel of the visualization. The settings at the top of the page are usually template-specific, whereas the bottom options (Layout, Header, Footer, Accessibility) work in the same way in all templates.
-

 Data tab – this is where you should

