How to connect to live data sources
Please note connecting to live data sources is only available on our Business Pro and Enterprise plans.
In this article
- 1
-
The Flourish Live CSV feature
Please note that downloading the HTML for self-hosting is not possible for visualizations created with the Live CSV feature. -
Our Live CSV feature allows you to point to a web-accessible CSV file instead of manually uploading your CSV or Excel file to Flourish. This live CSV file can be hosted on your own server or on third-party services such as Google Sheets.
-
Once enabled, you will receive the option to Import from URL alongside the Upload data file and Upload and merge options in the Data tab.
 When the Import from URL option is selected, you will receive the option to add a URL that links to a CSV. You can learn more about linking CSVs from different sources in this help doc.
 Once successfully linked, your datasheet will display greyed out and you won't be able to edit it, as it is being pulled from the live source.
 You can use the "Select columns to visualise" area to select which columns should be used for what part of the visualization. ( You can learn more about adding data and selecting columns here.)
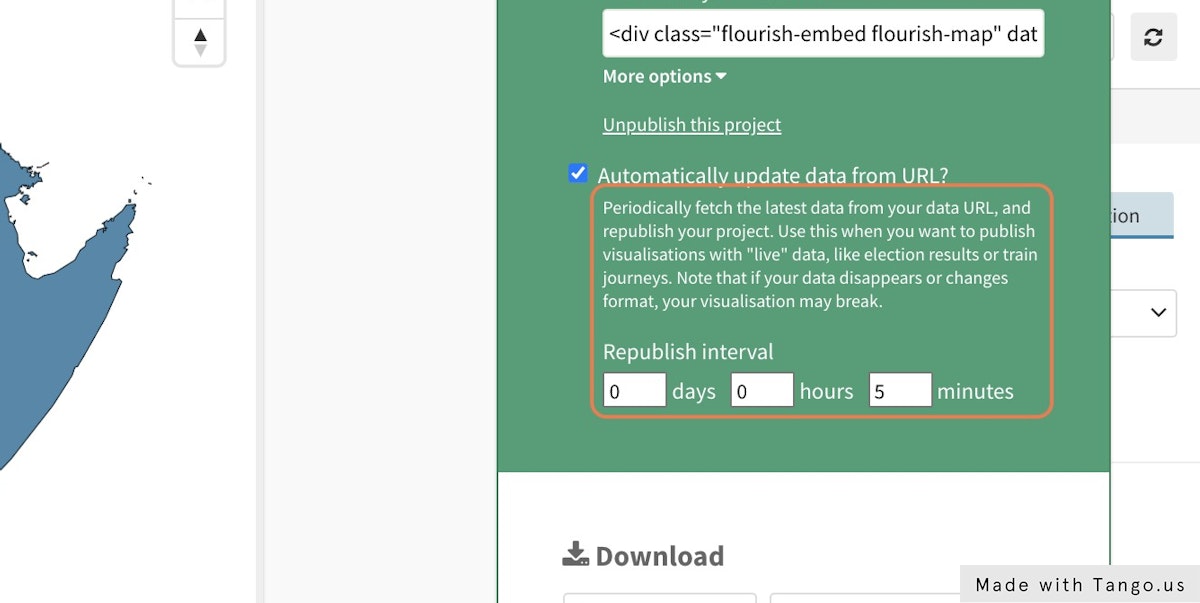
 To edit how often your CSV is pulled through to Flourish, you need to publicly publish your visualization. You will receive the option to automatically update the URL and can supply a republishing interval in minutes. (Please note that the minimum republishing interval is five minutes and republishing interval settings may be dependent on your tier of pricing plan.)
- Find out more about how to connect to different live data sources in this help doc.
-
If you add your visualization to a Flourish story, you will receive the same publishing settings.
- ✏️ Note: The republishing interval settings will not appear if you are trying to publish your project behind a password (and they will not work for self-hosted projects). We don't store the plain text version of a project password for security reasons, so each time a password protected project is republished you have to re-enter the password - that means it can't be done automatically.
- Each plan has a different minimum republish interval that they can republish by. Below is a list of the different plans that we have available and the minimum republish intervals:
-
Warning: We are currently experiencing a temporary delay with our minimum republish intervals, so you may experience longer times before your visualization is updated. We apologise for any inconvenience this causes.
- 2
-
The Flourish API
-
Note: the Flourish API is an enterprise-level bolt-on and not available to all customers
The Flourish API allows you dynamically create and edit Flourish visualizations. With the Flourish API you can for example:
- Connect a Flourish visualization to a database or live data feed
- Control Flourish visualizations based on inputs on your webpage
- Make a custom CMS plugin that can generate Flourish charts
- Create Flourish charts as part of R, Tableau, Jupyter or Observable notebooks
Find out how to get started or read how to make and update a visualization.
 When the Import from URL option is selected, you will receive the option to add a URL that links to a CSV. You can learn more about linking CSVs from different sources in
  Once successfully linked, your datasheet will display greyed out and you won't be able to edit it, as it is being pulled from the live source.
 You can use the "Select columns to visualise" area to select which columns should be used for what part of the visualization. ( You can learn more about adding data and selecting columns
  To edit how often your CSV is pulled through to Flourish, you need to publicly publish your visualization. You will receive the option to automatically update the URL and can supply a republishing interval in minutes. (Please note that the minimum republishing interval is five minutes and republishing interval settings may be dependent on your tier of pricing plan.)