How to pull through data from a Google Sheet
This help doc walks you through pulling through data from a Google Sheet using our Live CSV feature. This feature is only available to our Business Pro and Enterprise customers.
- 1
- To connect to a Google Sheet, you will need to have the Live CSV feature enabled. If you do, you will receive the option to Import from URL alongside the Upload data file and Upload and merge options in the Data tab. Select the Import from URL option to get started.
-

- 2
- Next, go to the Google Sheet you would like to pull your data through from. Make sure it doesn't have any extra rows or headers and that it is in a format that is suitable for the template you would like to use it for (to ensure this, we recommend taking a look at the example data in the template's blueprint and trying to recreate that structure). If it has the right structure, go to File > Share > Publish to web.
-

- 3
- In the Publish to the web settings, you'll have to define which sheet of your document you'd like to publish and that you'd like to make it available as a CSV file. Once you've made these settings, you can hit Publish and a public link to your CSV will be generated.
-

There are some more advanced settings regarding privacy and republishing changes. As your sheet will have to be publicly accessible to Flourish, you should untick the setting that your file should only be available to people within your organization. You can also select for changes to your document to be automatically published. We recommend leaving this selected, as it means you won't have to republish every time you make a change.
-

-
Then, head over to Share settings and change the default access settings to Anyone with the link, then press Done.
-

-
Then go back to Publish and grab the CSV link.
- 3
- Next, go back to your Flourish project, click on the Import from URL button and paste the URL that you just copied from Google Sheets. Your live CSV file will now be imported and the data tab will appear greyed out. This means you won't be able to edit your data manually, as it is being pulled through from the Google Sheet.
-

- 4
- Next, select the columns you'd like to visualize as you would in a normal Flourish project. Even though your data area is greyed out, you should be able to scroll to see all columns. Columns that are selected will be colored, and a preview of your visualization will appear in the bottom right corner.
-

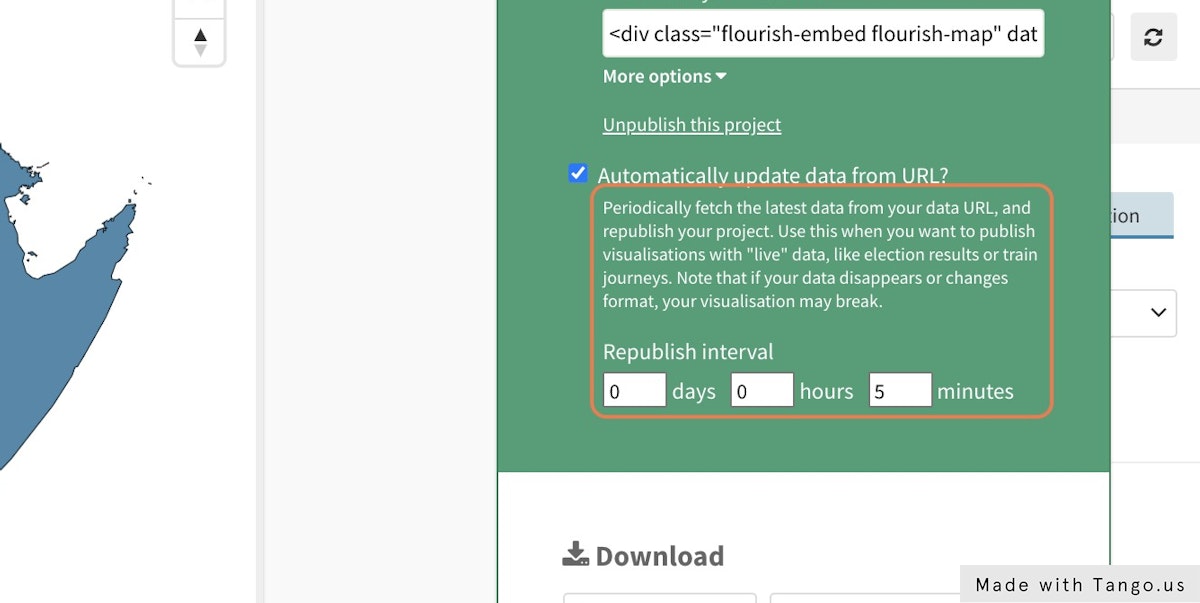
- 5
- The last thing you will need to do is publicly publish your visualization and set an updating interval. You can do this in the settings upon publishing by supplying an interval in minutes.
- ✏️Note: The minimum republishing interval is five minutes and republishing interval settings may be dependent on your tier of pricing plan.
-
- ✏️Note: The republishing interval settings will not appear if you are trying to publish your project behind a password (and they will not work for self-hosted projects). We don't store the plain text version of a project password for security reasons, so each time a password protected project is republished you have to re-enter the password - that means it can't be done automatically.
- 6
- You can also add this visualization to a Flourish story, and the same republishing interval settings will apply.
- 7
- If you would like to unlink your Google Sheet from Flourish because your live reporting has ended or because you would like to update the data manually in Flourish, you can select Unlink and keep current data. This will allow you to edit your data and will no longer update with the Google Sheet. If you would like to reconnect to the Google Sheet, you would have to repeat the steps.
-