How to override the shape order of the Scatter plot
If you have various categories in your Scatter plot, you can set different shapes for each of them.
To do this:
1
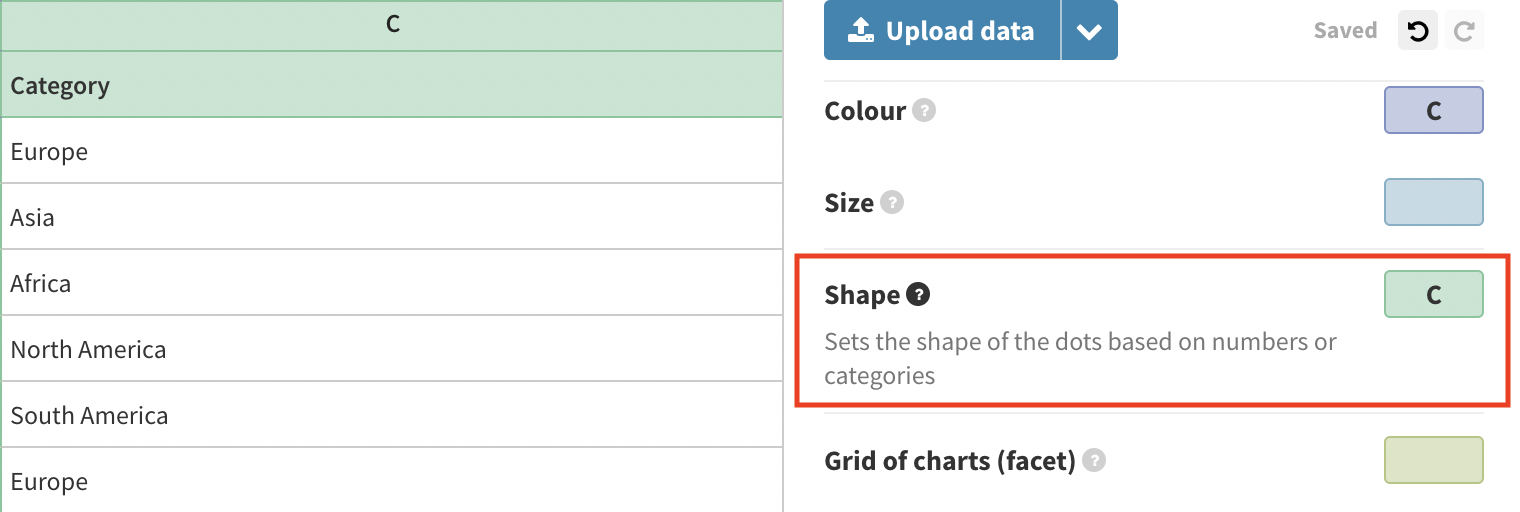
You will need a categorical or numerical column according to which the different shapes will be distributed. Bind this column under Shape in the Data tab.
2
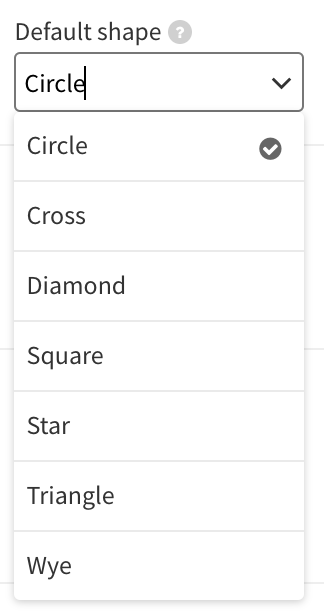
At the moment, we have seven default shapes imported in the Scatter. You can find them under Dot styles >> Default shape.
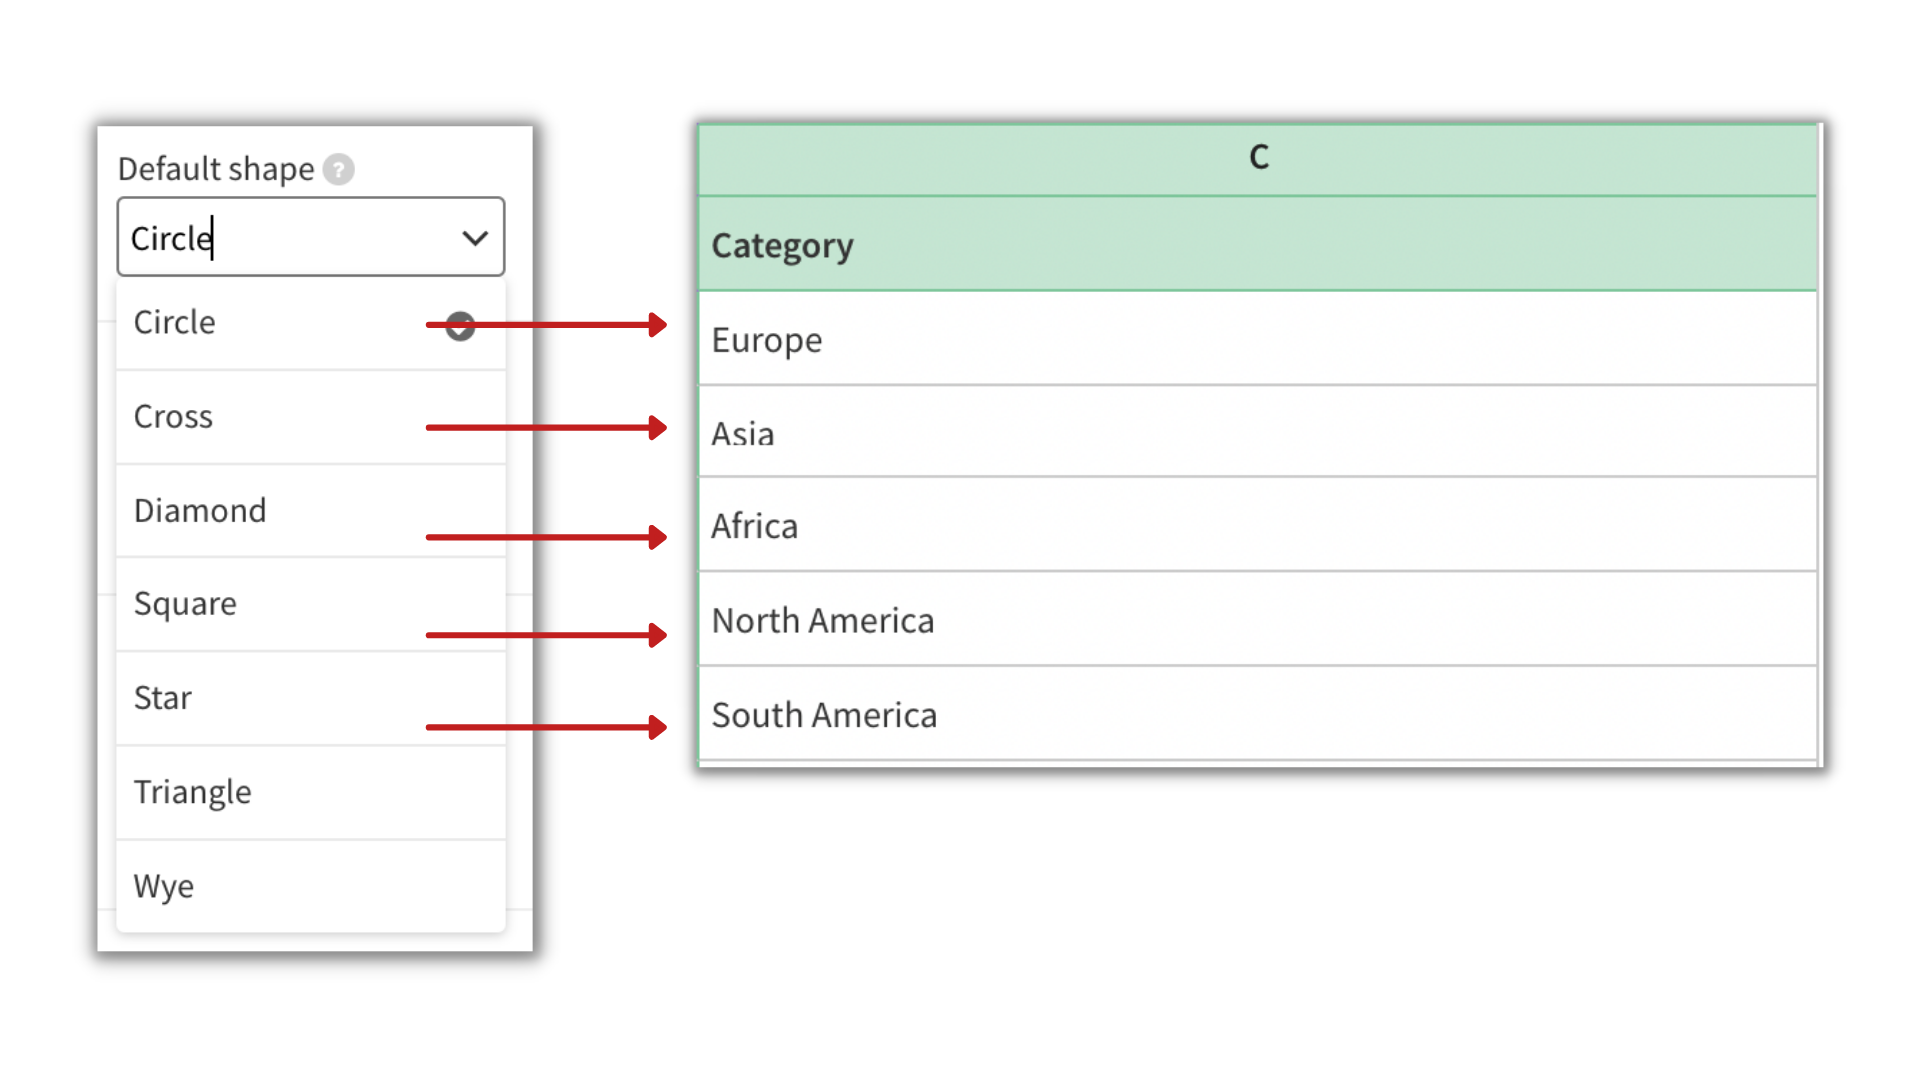
Depending on the order of your categories in the Data tab, these shapes will be divided accordingly. In other words, Europe will be represented by a circle, Asia by a cross, Africa by a diamond, and so on.
However, please note that if you have more than 7 categories, the shapes will eventually start repeating.
3
If you would like to change the order of your shapes, you can do that by swapping the order of the categories within the Data tab. Therefore, if we swap Europe with Asia in the example below, the shapes will swap, too.
4
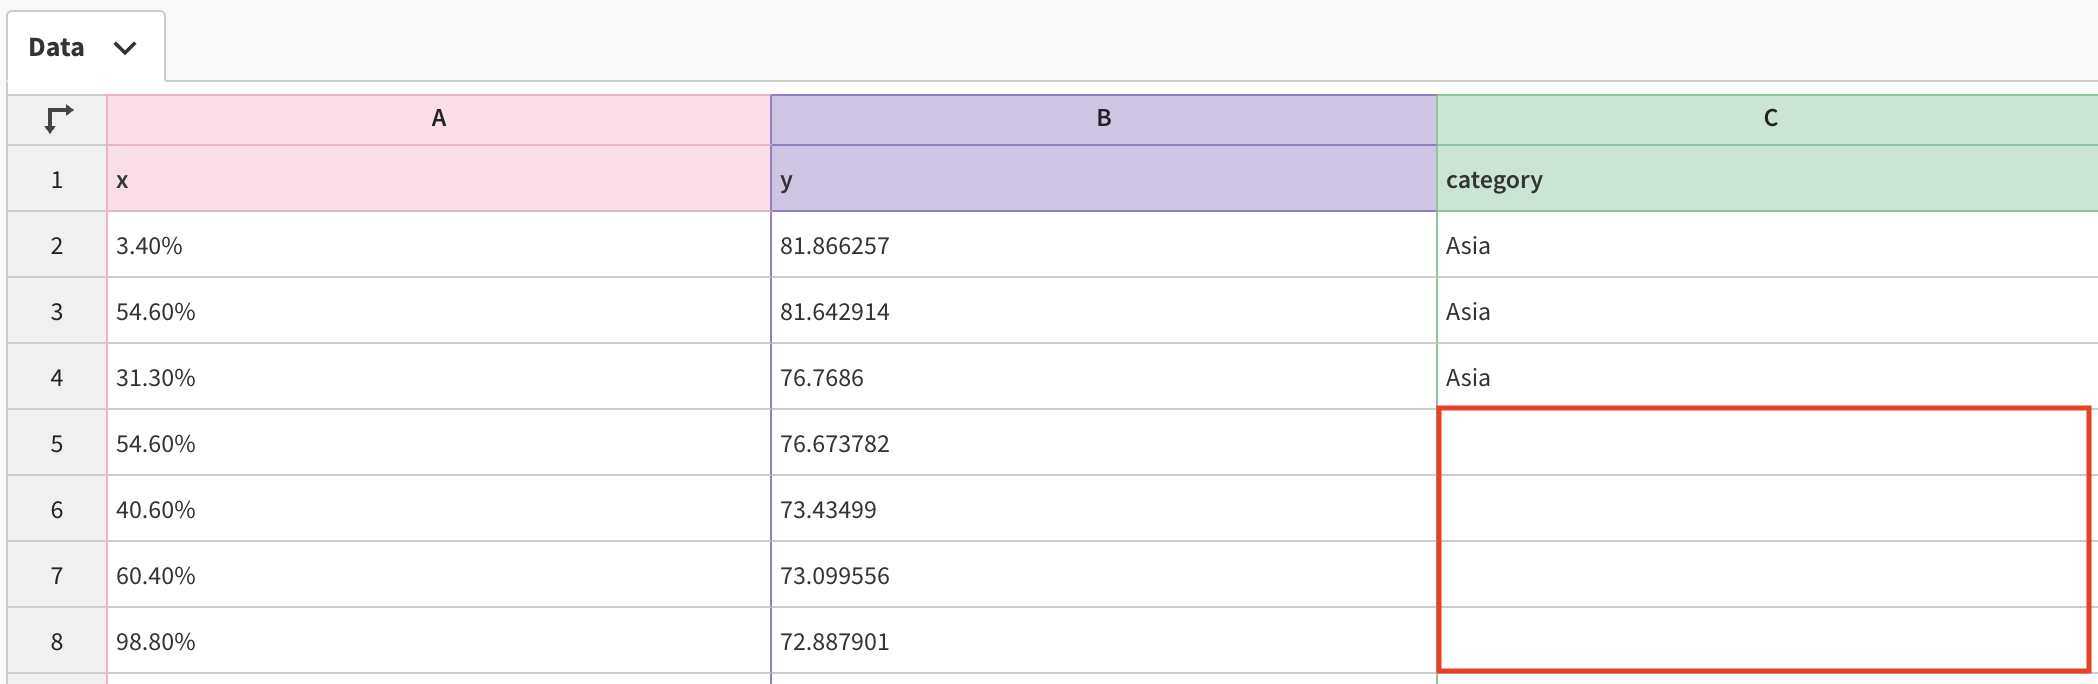
If you leave a category input empty, the series will adopt the Default shape specified in the Preview tab.