How to create an animated line chart with a time slider
While we have multiple animated templates available, such as the Line chart race and Bar chart race, you can also create an animated line chart by using our Line, bar, pie template. Learn how to do this below!
In order to create your animated line chart, you should analyze how your datasheet is structured. Whether the data is in a wide or long format will determine which filter would you use to create the animated effect – the Row or Series filter.
1
If your data is in a wide format, you will need one column for your X axis values and separate columns for each day/month/time period.
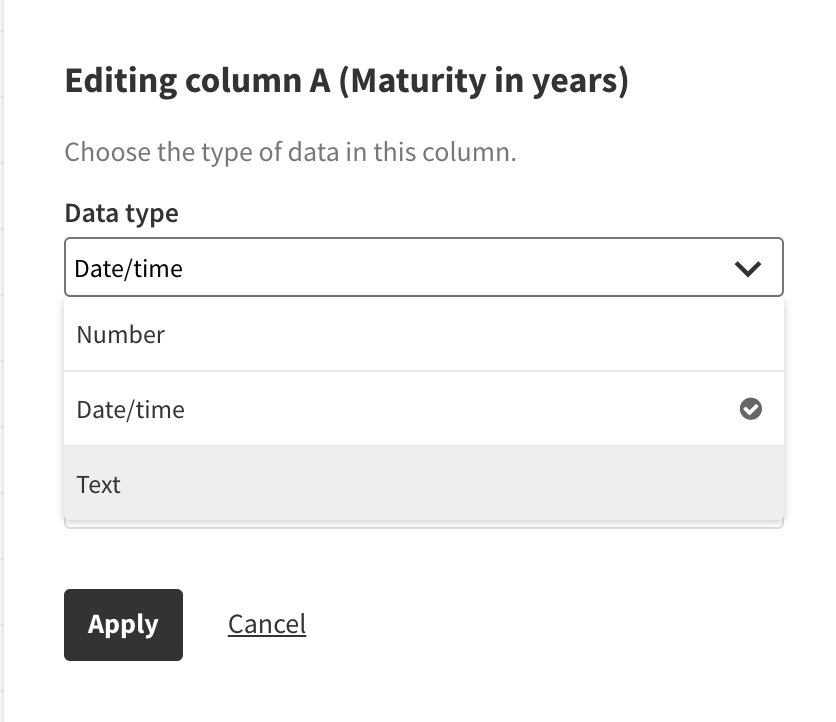
 Please note: Your X axis column type needs to be "text" or "date". If you have number values, simply click the 123 symbol at the top of the column to bring up the column data type menu, and switch to a text column.
2
If your data is in a long format, you will need one column for your X axis (in the example below, Maturity in years), at least one column for Value and one column containing all days/months/periods, which you will bind under Row filter.
You should use this data format if you aim to animate more than one line.

TIP: You may benefit from the restructuring tools we offer in Flourish. In these help docs, you can read more about pivoting tables, unpivoting data and transposing columns.
Creating an animated line chart
1
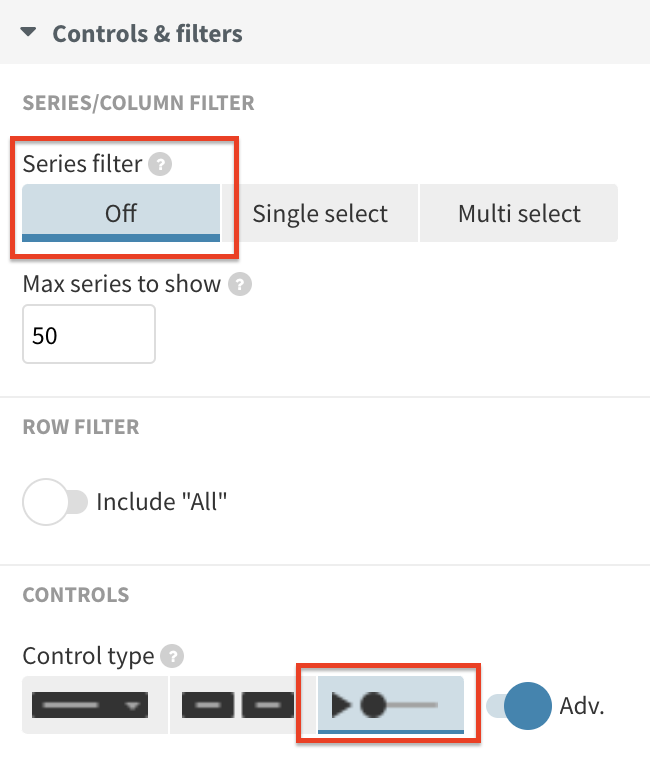
Under Controls & filters in the Preview tab, you can create or customize the look of your filter. If you are working with a wide data format, select Single select and choose the Time slider control type.

If your data is in a long format, keep the Series filter turned off, but change the Row filter to a Time slider control type.
2
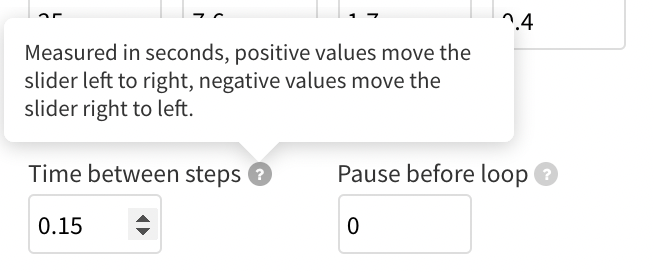
Under the Advanced settings, you can set the Time between steps, which will determine the speed of your animation. To achieve a greater animated effect, we recommend choosing a faster speed, for instance, 0.15s.
3
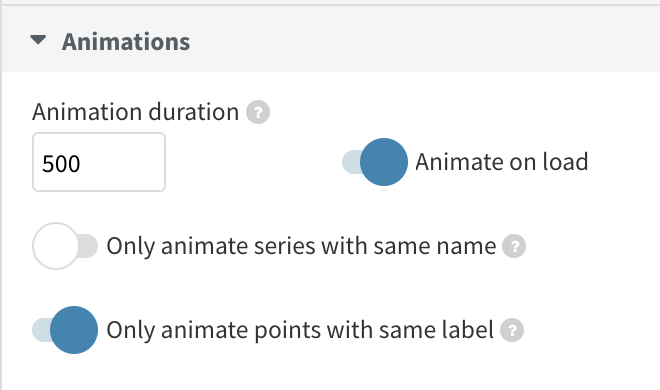
Under Animations, turn off the Only animate series with the same name toggle, in order to create a smoother transition between each line. You can also adjust the overall animation of the visualization.
4
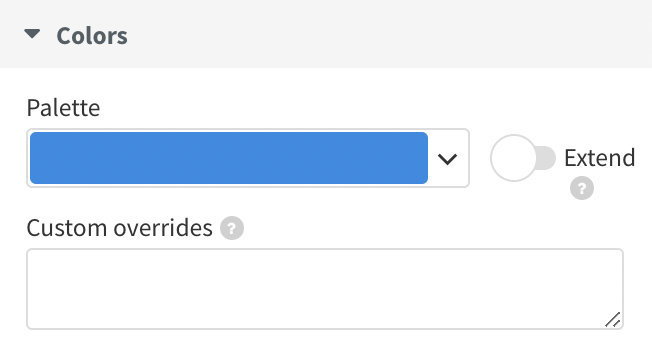
In most cases, you may want to reduce the color palette to a single color, as well as turn off the Extend to avoid the data changing color as you play through time. Read how to customize Flourish color palettes here.
5
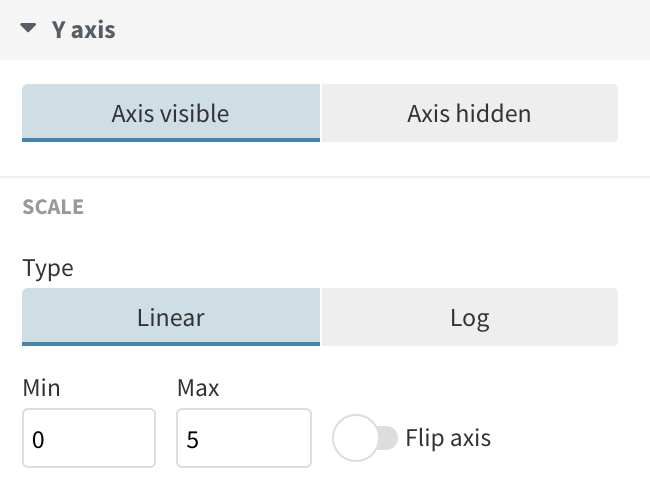
You may also set a minimum and maximum values of your Y axis, to avoid the value changing while the line goes through time.